XRP price started a decent increase above $1.40. The price is now consolidating gains and might aim for more gains above the $1.50 zone.
- XRP price started a decent upward move above the $1.420 zone.
- The price is now trading above $1.4250 and the 100-hourly Simple Moving Average.
- There was a break above a key bearish trend line with resistance at $1.3820 on the hourly chart of the XRP/USD pair (data source from Kraken).
- The pair could continue to move up if it settles above $1.50.
XRP Price Rally Reaches Resistance
XRP price started a fresh upward move above $1.40 and $1.420, like Bitcoin and Ethereum. The price gained pace for a clear move above the $1.450 resistance.
There was a break above a key bearish trend line with resistance at $1.3820 on the hourly chart of the XRP/USD pair. The bulls even pumped the price toward the $1.50 zone. A high was formed at $1.4936 and the price started a consolidation phase. There was a drop below the 23.6% Fib retracement level of the upward move from the $1.3125 swing low to the $1.4936 high.
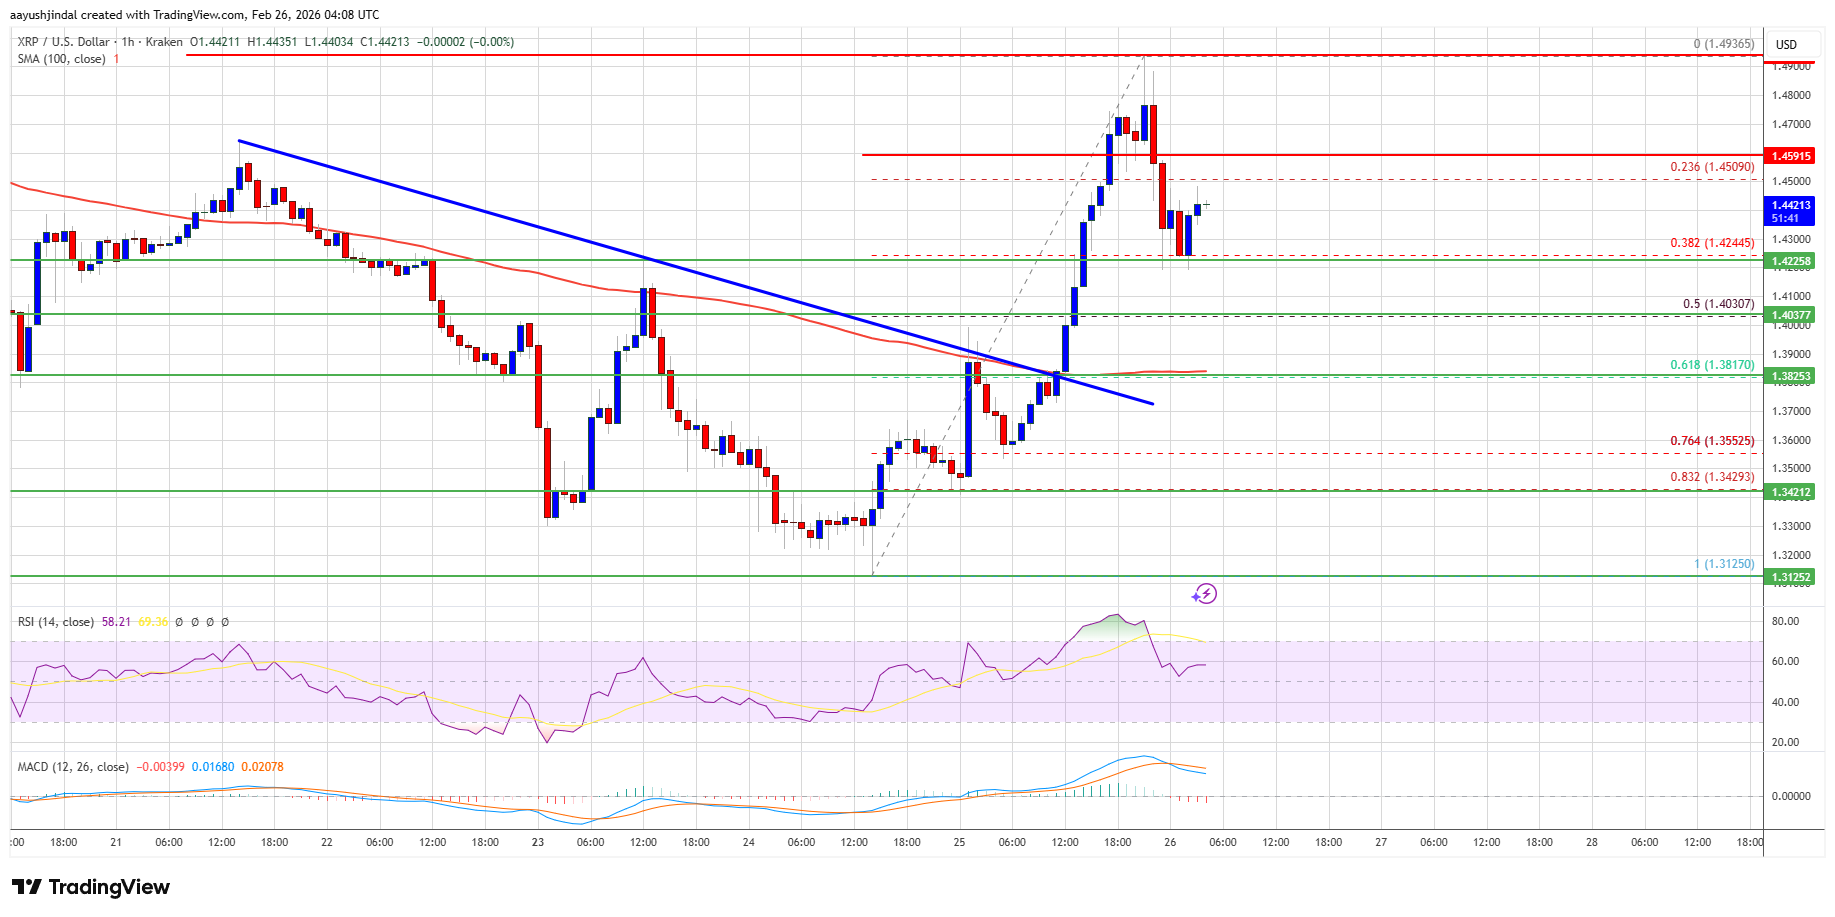
The price is now trading above $1.420 and the 100-hourly Simple Moving Average. If there is a fresh upward move, the price might face resistance near the $1.460 level. The first major resistance is near the $1.50 level, above which the price could rise and test $1.5450. A clear move above the $1.5450 resistance might send the price toward the $1.650 resistance. Any more gains might send the price toward the $1.720 resistance. The next major hurdle for the bulls might be near $1.80.
Another Decline?
If XRP fails to clear the $1.460 resistance zone, it could start a fresh decline. Initial support on the downside is near the $1.420 level. The next major support is near the $1.4030 level or the 50% Fib retracement level of the upward move from the $1.3125 swing low to the $1.4936 high.
If there is a downside break and a close below the $1.4030 level, the price might continue to decline toward $1.3820. The next major support sits near the $1.3430 zone, below which the price could continue lower toward $1.320.
Technical Indicators
Hourly MACD – The MACD for XRP/USD is now losing pace in the bullish zone.
Hourly RSI (Relative Strength Index) – The RSI for XRP/USD is now above the 50 level.
Major Support Levels – $1.420 and $1.4030.
Major Resistance Levels – $1.460 and $1.50.


 English (US) ·