Key Findings:
- Total stablecoin supply added only $8 billion in Q1 2026 — the weakest expansion since Q4 2023, as the market rotated rather than grew.
- Yield-bearing stablecoins grew over 22% in Q1, contributing more than half of net stablecoin market cap increase.
- Stablecoins accounted for 75% of all crypto trading volume in Q1 2026, the highest share ever recorded.
- Total stablecoin transaction volume surpassed $28 trillion in Q1 2026, reaching a new all-time high. 76% of that volume was bot-driven — the highest level in two years.
- Retail-sized stablecoin transfers fell 16% in Q1 2026 — the largest drop on record, with the closest comparable decline in Q1 2022.
Across the crypto sector, Q1 2026 has been drawing comparisons to 2022. Bitcoin posted its worst start to a year since the 2022 bear market, while multiple volatility, volume, and on-chain metrics have been resembling mid-2022 patterns. Stablecoin data is telling a similar story shaped by two parallel forces.
On one side, the broader risk-off environment pushed more capital toward stablecoins as a defensive hold, driving their share of crypto trading volume to all-time highs and accelerating demand for yield-bearing alternatives. On the other, regulatory momentum continued to build, with stablecoin yield potentially creating new friction. Separately, the Office of the Comptroller of the Currency released a proposal to implement the GENIUS Act, which could hamper stablecoin rewards programs more broadly.
The result was a quarter that looked, on many metrics, like a classic bear market reset — but with a stablecoin market that is structurally much larger, more institutionally integrated, and more regulatory-aware than it was in 2022. Here is what this means and what path forward this may develop.
Supply Dynamics
Mid-2022 Rotation Trends
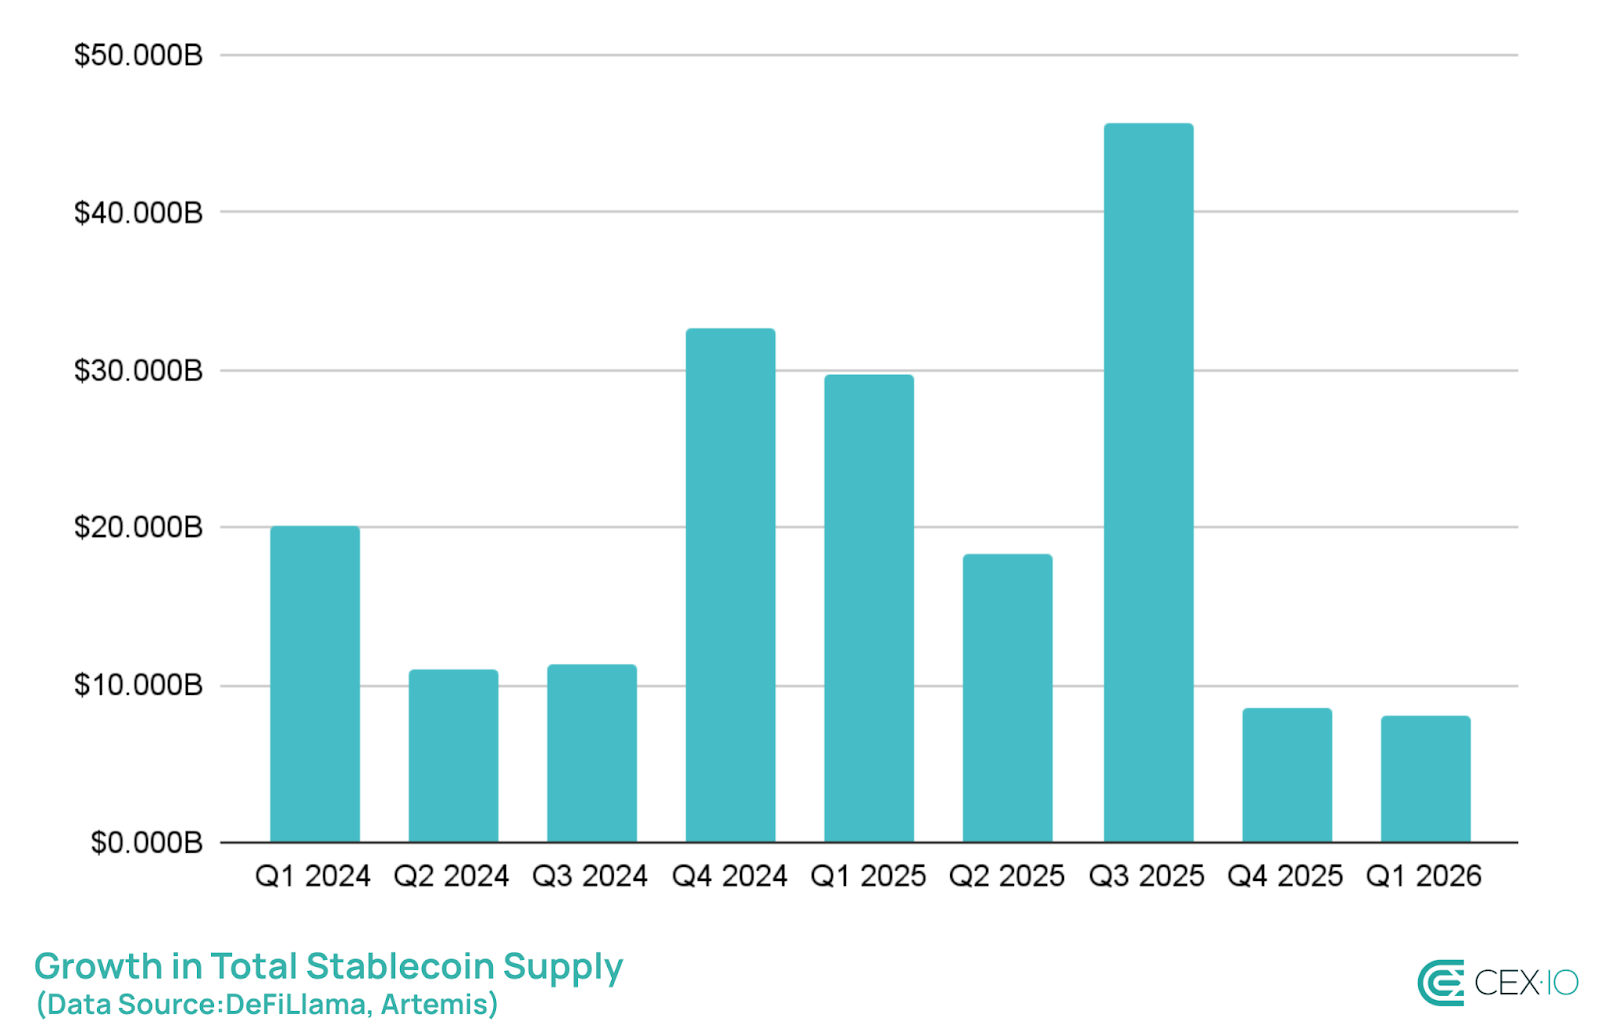
By the end of Q1 2026, the total stablecoin supply crossed $315 billion, updating its all-time high. However, the quarter added only around $8 billion in net new supply, marking it the weakest quarterly expansion since Q4 2023, and a sharp contrast to the $45.7 billion added in Q3 2025.
In relative terms, the supply expanded by only 2.6%, while the total crypto market cap dropped by 21%. As a result, stablecoins’ dominance in the crypto market cap briefly jumped from 9% to 13%, for the first time since early 2023. This suggests that the market is increasingly rotating toward stablecoins, and a nature of this rotation resembles mid-2022, when stablecoin dominance surged from 8% to 17% as investors were seeking defensive positioning and capital preservation.
Another similarity with mid-2022 is the divergence between the two leading assets. In Q1 2026, USDC gained $2 billion in supply, while USDT shed $3 billion. The last time the two moved this way simultaneously was Q2 2022.
As such, if the pattern holds and bearish conditions persist, the crypto market could see further increase in stablecoin dominance and demand. However, this doesn’t necessarily mean further stablecoin supply expansion as it remains under pressure due to USDT.
Yield-Bearing Stablecoins Fueled More Than Half of Net Supply Increase
Aside from USDC, one of the biggest drivers behind supply growth in Q1 2026 was market restructuring around yield. Yield-bearing stablecoins, assets that pass returns directly to holders, often through exposure to U.S. Treasuries or DeFi lending, grew by over 22% in Q1 alone, marking it the best-performing category in the sector. This means they added around $4.3 billion in market cap, accounting for the majority of stablecoin growth last quarter.
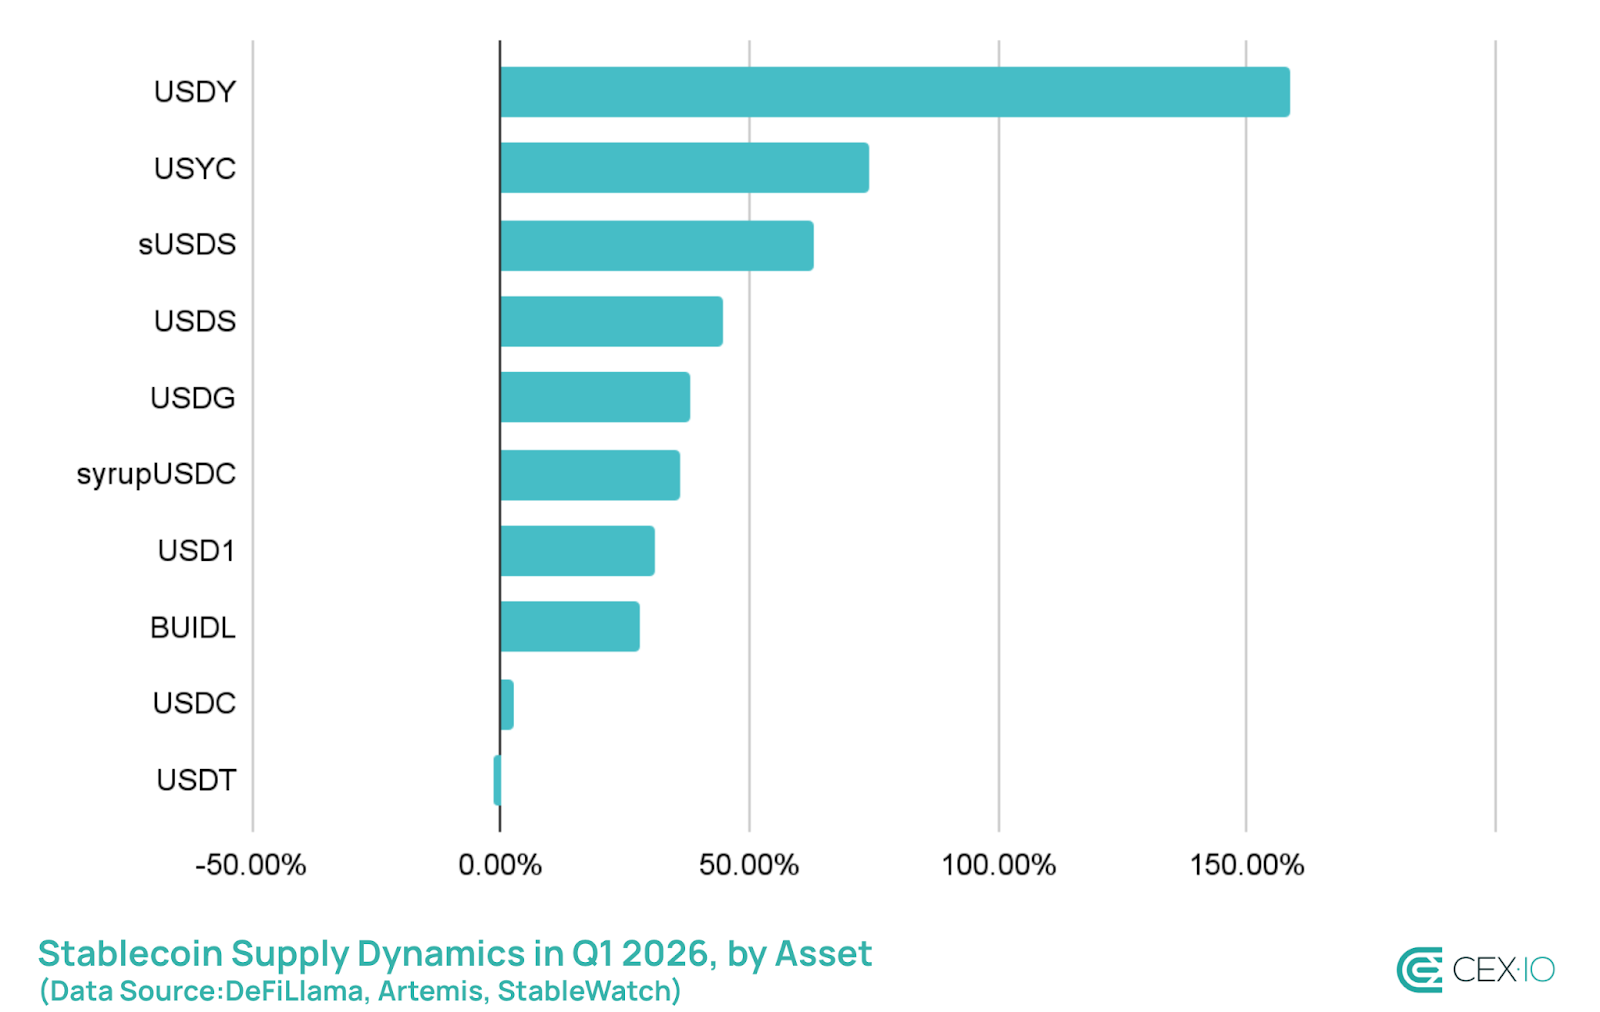
As a result, yield-bearing stablecoins are dominating among assets posting the largest supply gains in Q1 2026. For instance, USDY’s market cap saw an over 150% increase in Q1, while sUSDS added more than $2.5 billion in market cap, more new capital than the next four yield-bearing stablecoins combined in absolute terms.
Other top performers are also closely linked to yield-generating mechanisms. USDS, for instance, largely serves as an entry point to sUSDS, while USD1 has benefited from the launch of World Liberty Markets, which expanded its DeFi utility and yield access. So even where the yield is indirect, it is clearly driving adoption.
One of the major reasons behind this expansion was a broader risk-off environment, which pushed investors to look for efficient ways to park their capital, and capital preservation with yield became more attractive.
Another catalyst could be the ongoing discussions about stablecoin yield within the Clarity Act framework. Specifically, it’s about whether centralized exchanges should be allowed to pay yield on stablecoin balances, a model that banks see as a direct threat to their deposit business. The recent text updates would ban yield payments for simply holding a stablecoin on CEX balances, which could further expand the appeal of yield-bearing stablecoins.
Biggest Drop of USDT Supply on Ethereum Ever
In terms of network distribution, Tron was the clear winner, adding more than $4 billion in stablecoin supply in Q1 2026, mainly in USDT. However, this growth came alongside a major shift away from Ethereum L1. More than $7 billion of USDT left Ethereum during the quarter — the largest drop on record. For comparison, this is close to the total USDT outflows on Ethereum seen during the entire 2022 bear market.
Notably, this decline was almost fully offset by growth in USDC and yield-bearing stablecoins on Ethereum. This suggests users are rotating within the Ethereum ecosystem rather than exiting it.
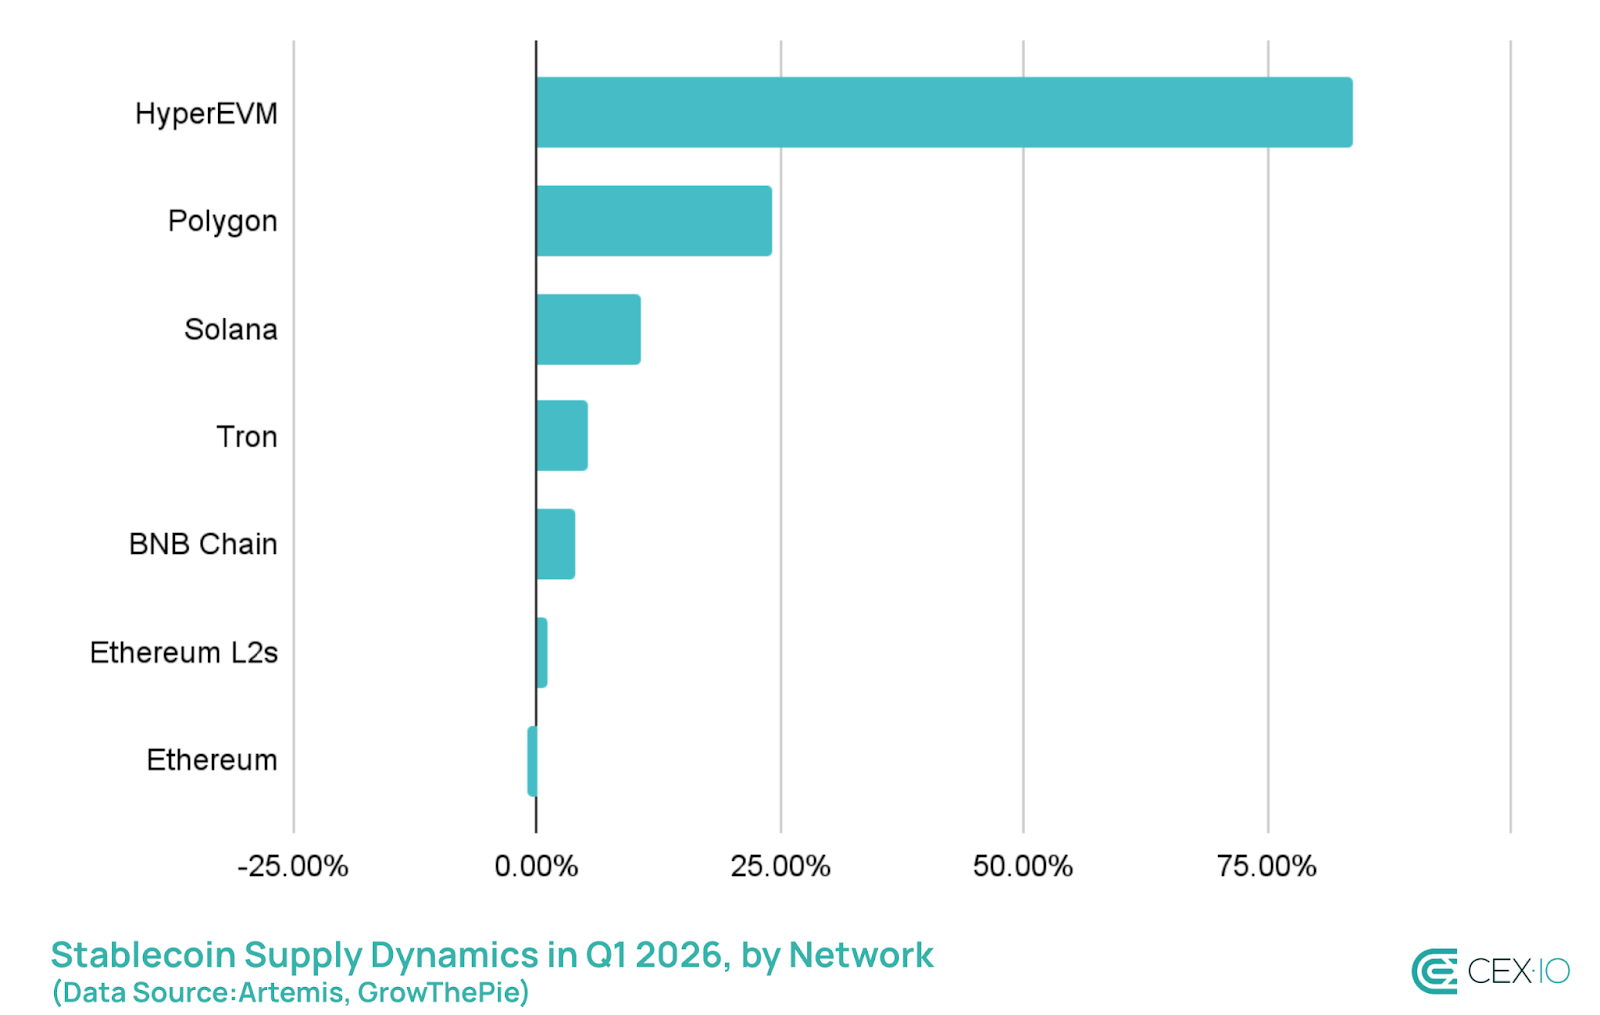
Among smaller ecosystems, Solana saw the largest growth in absolute terms, adding more than $1.6 billion in supply. HyperEVM led in relative growth, with its stablecoin supply increasing by more than 80% in Q1 2026.
Trading Volume Dynamics
Stablecoins Are Eating Crypto Volume
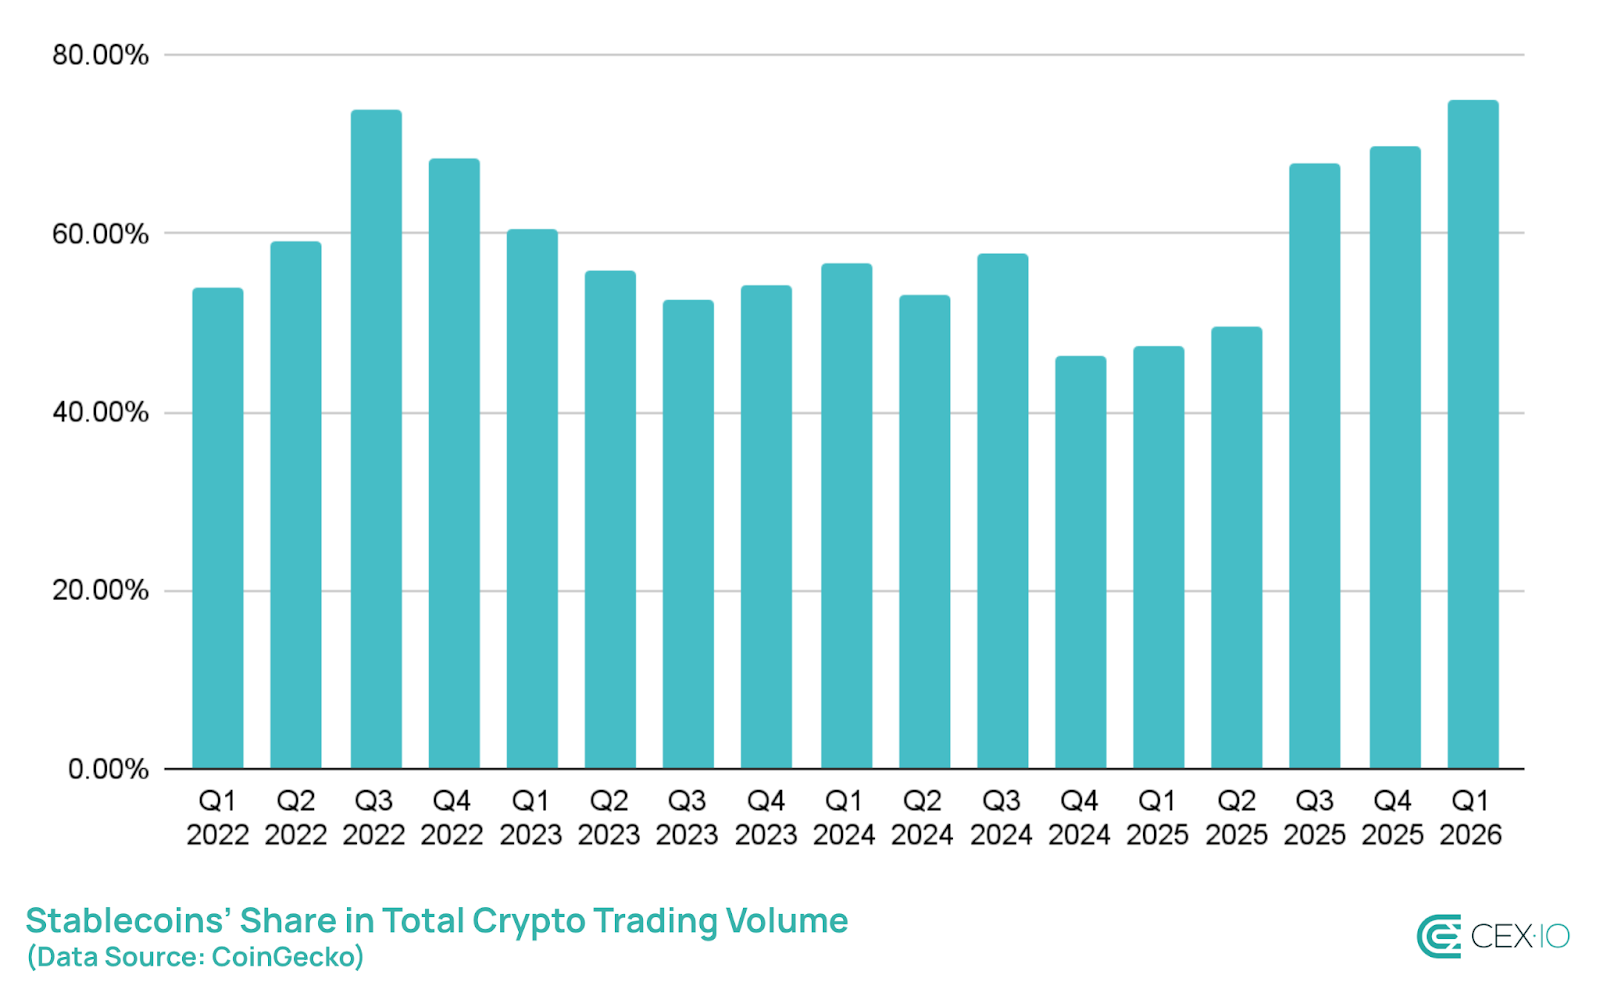
Stablecoins are now dominating crypto trading activity more than ever before. In Q1 2026, stablecoins registered $8.3 trillion in trading volume, accounting for 75% of total crypto trading volume, the highest share on record. This surpasses the previous peak of 72% in Q3 2022.
As such, stablecoin trading volume appears to be healthy in absolute terms. Q1’s $8.3 trillion total runs ahead of the same period in both 2025 and 2024. The difference is that the broader crypto market has contracted relative to stablecoins dramatically.
This dynamic strongly echoes mid-2022 behavior, when uncertainty pushed capital into stable pairs and sidelined directional risk.
USDT is at the center of that story. Despite its supply declining, USDT alone accounted for 68% of all crypto trading volume (up from 63% in Q4 2025) and 86% of all stablecoin trading volume in Q1 (down from 87% in Q4 2025).
USDC Gains Ground as USDT Reserves Decline
Although USDT stayed dominant in trading volume, USDC is quietly strengthening its position. Its share of stablecoin trading volume increased from 9% to 10% quarter-over-quarter, showing a slight rotation from USDT.
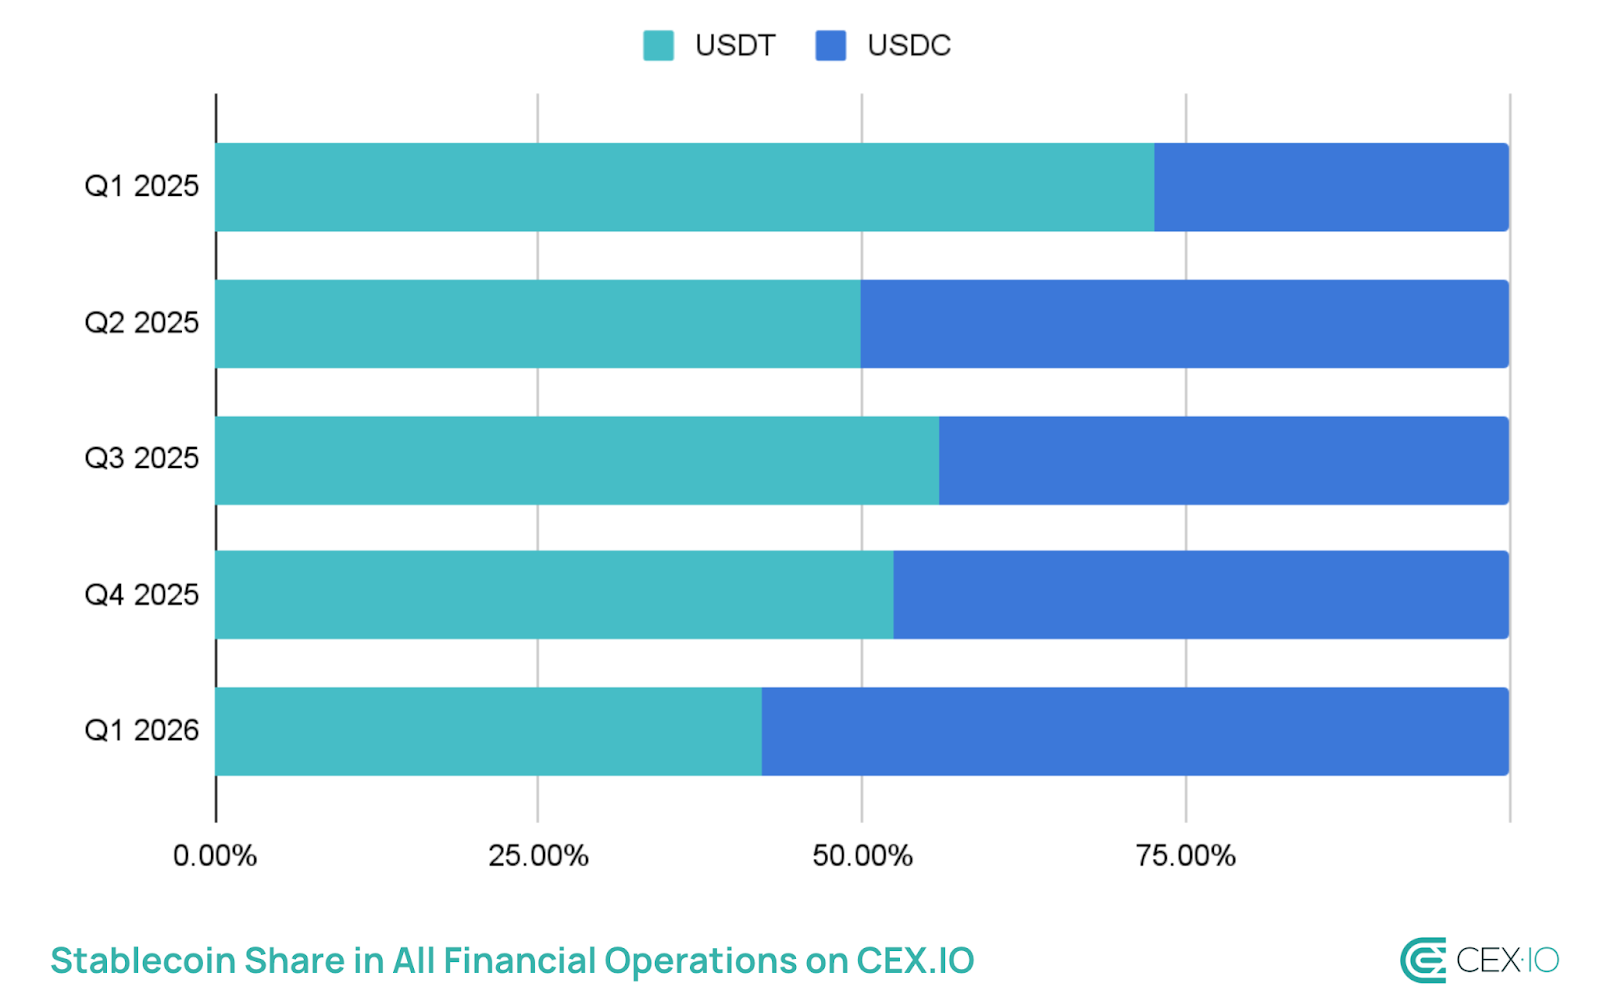
CEX.IO’s internal data shows the same shift, but in more striking terms. Across all financial operations involving stablecoins, including trading and on-chain transactions, USDC’s share rose from 48% in Q4 2025 to 58% in Q1 2026.
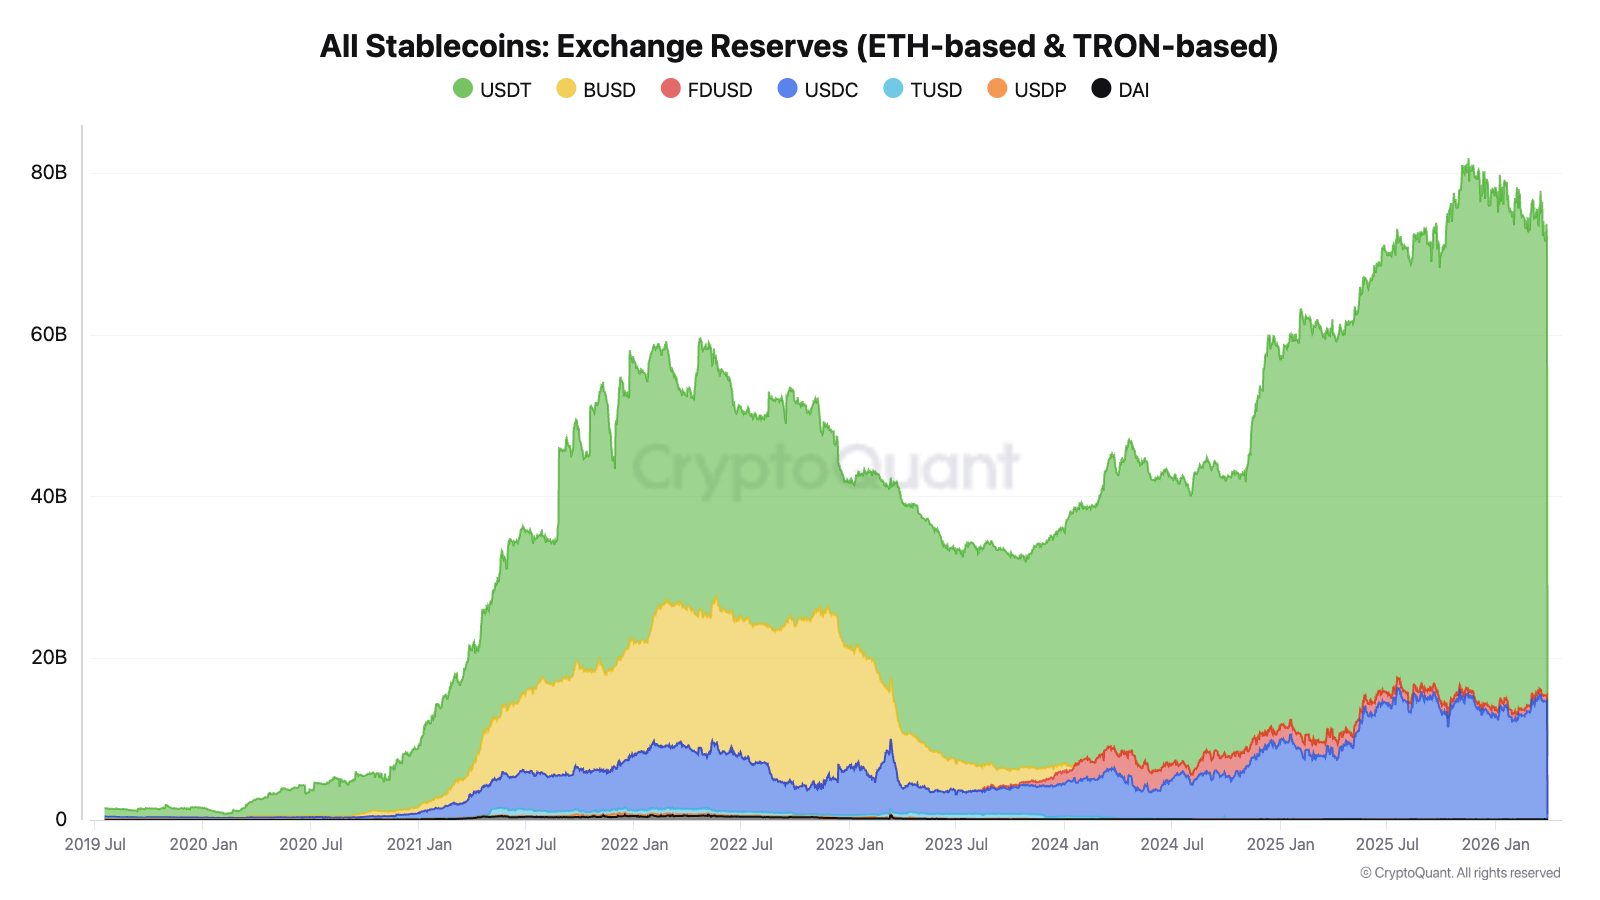
However, the biggest change occurred in exchange balances. USDC exchange reserves increased by over 12% in Q1 2026, while USDT reserves fell by 12%. This suggests increased USDC adoption on CEXs, as well as that “wait and see” users were actively stockpiling USDC.
The DEX volume supports this claim as its share in USDC trading volume decreased from 27% to 23%. This indicates that USDC has primarily seen an increase of its volume on CEXs.
Transaction Volume Dynamics
The Largest Bot Activity Ever on Ethereum and Tron
Stablecoin transaction activity reached a new all-time high in Q1 2026, with total volume surpassing $28 trillion and showing a 51% increase compared to Q4 2025. However, most of this activity and growth was not organic. Around 76% of all stablecoin transaction volume in Q1 2026 was driven by bots, up from 70% in Q4 2025, and the highest level since Q2 2024.
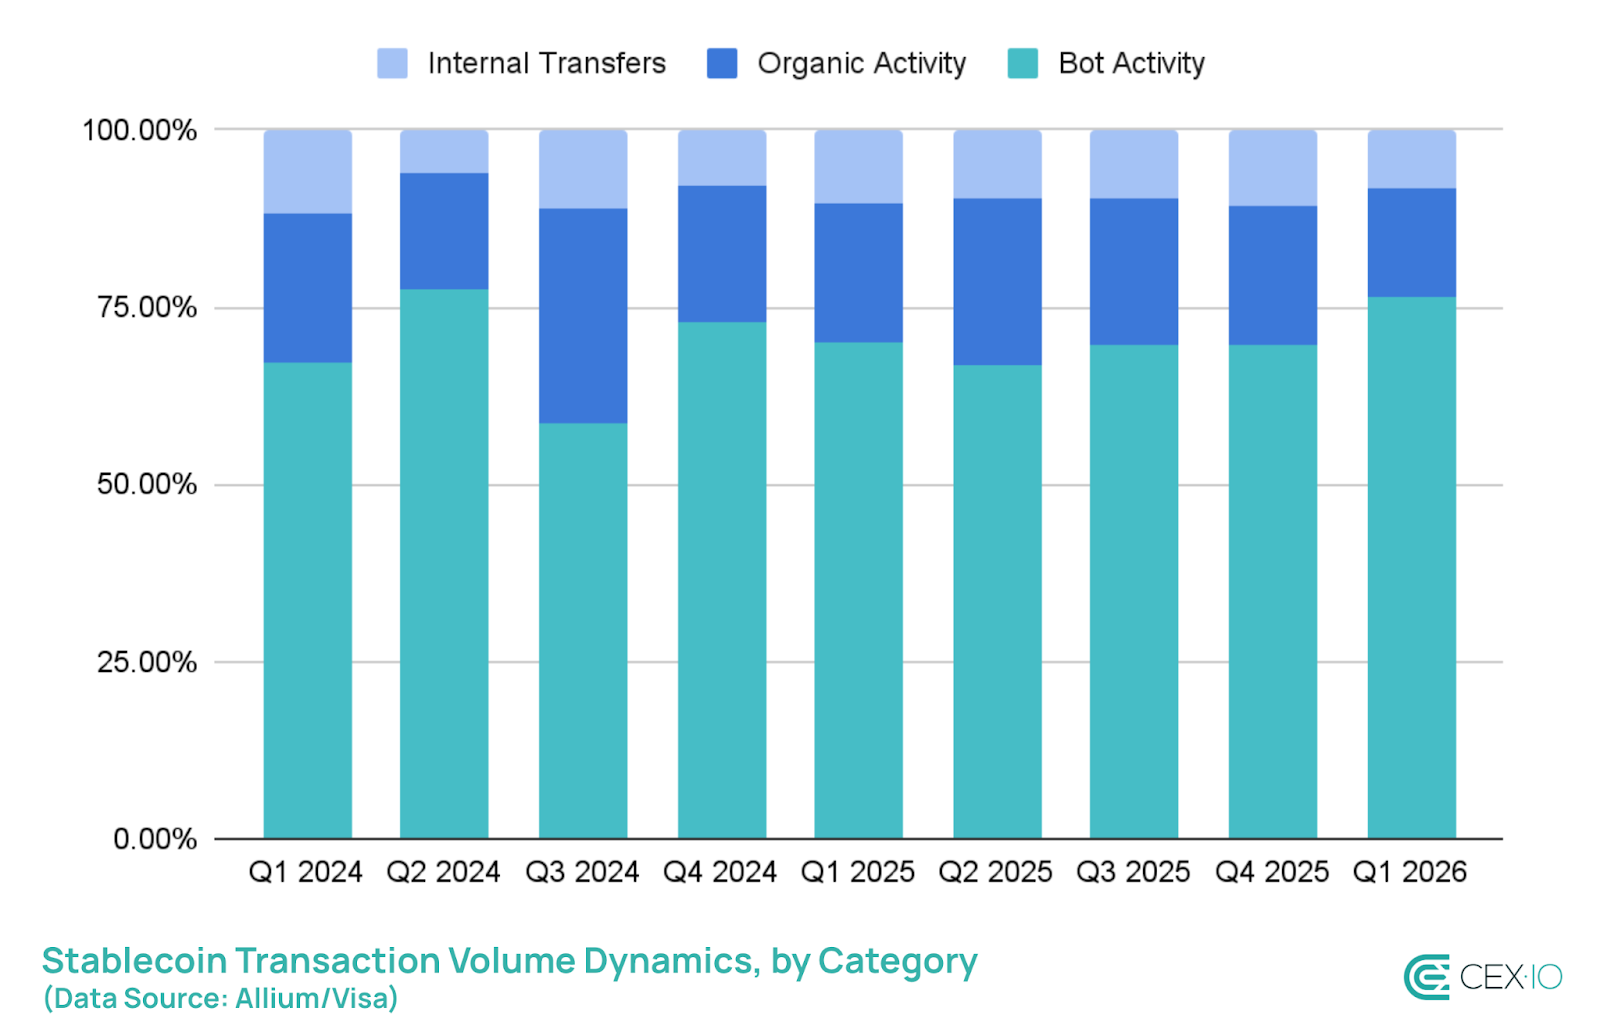
Note: Organic activity is measured as adjusted volume using the Adjusted Transaction Methodology. Bot activity combines Bot and Other (Unadjusted) transactions. Internal transfers include internal smart contract transactions and intra-exchange transfers.
When broken down by network, the bot activity trends become even more pronounced. In Q1 2026, Ethereum and Tron recorded their highest levels of bot-driven stablecoin activity ever, reaching 72% and 54%, respectively.
One of the drivers behind this move could be the increasingly risk-off environment. Instead of taking directional bets, traders are relying more on low-risk strategies like arbitrage, which are largely automated.
This is especially visible on Ethereum DEXs, where stablecoin swaps now make up the majority of trading volume. As this share has grown, so has the presence of automated activity. In fact, the share of automated programs on Ethereum DEXs also reached an all-time high in Q1 2026.
USDC Registered Its Largest Share in Organic Volume
USDC accounted for 80% of total stablecoin transaction volume and 85% of all bot-driven activity in Q1 2026. As automation increased, it further reinforced USDC’s dominance across the stablecoin landscape.
At the same time, USDC also recorded one of its strongest gains in organic (adjusted) activity, with volume rising by 59% quarter-over-quarter. In contrast, USDT moved in the opposite direction, with its organic volume declining by 17%, marking one of its steepest drops on record.
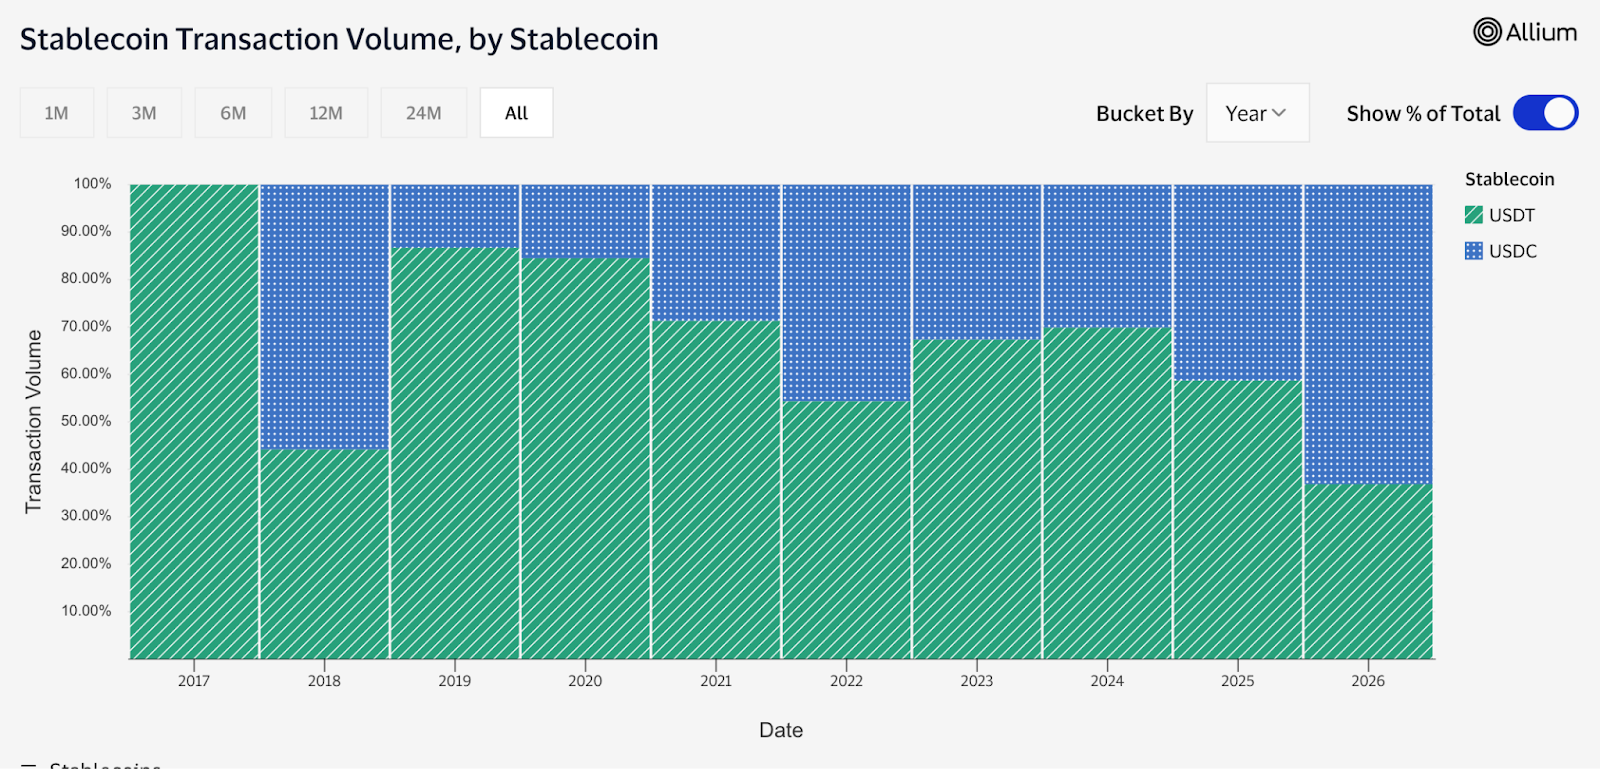
This divergence led to a complete shift in the structure of real usage. For the first time since 2019, USDC overtook USDT in organic (adjusted) transaction volume. Furthermore, on an annualized basis, USDC now accounts for around 63% of organic volume, the highest share ever recorded, outpacing 2018 values.
This suggests that USDC is no longer just leading in infrastructure and automated flows, but is increasingly becoming the primary asset for real on-chain activity. Meanwhile, USDT’s role appears to be drifting more toward off-chain trading activity, reinforcing the growing divide between how the two stablecoins function within the ecosystem.
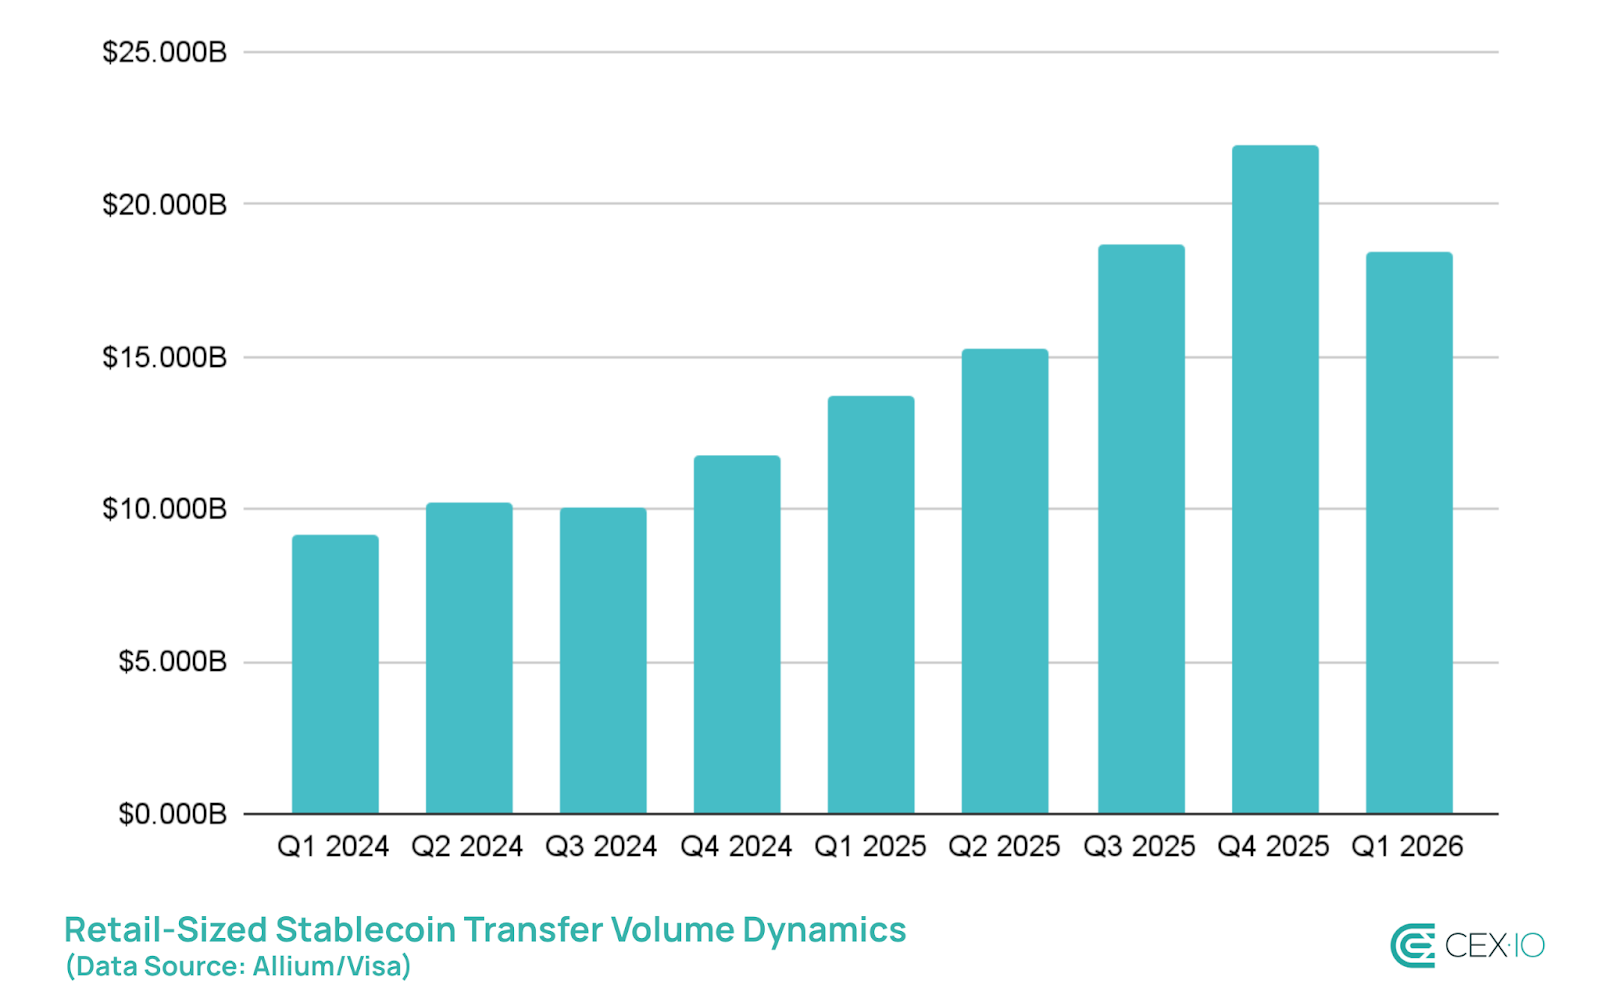
The Biggest Drop Ever in Retail-Sized Transfers
For years, retail activity has been one of the most consistent growth stories in the stablecoin landscape. Almost every quarter, retail-sized transactions, or those below $250, have reached new all-time highs, reflecting steady adoption in payments, remittances, and peer-to-peer use.
However, in Q1 2026, retail-sized stablecoin transfers declined by 16%, marking the largest drop on record. The most comparable decline occurred in Q1 2022, at the start of the bear market, when retail-sized volume fell by about 12%.
This pullback was likely driven by broader market caution and reduced user activity in a risk-off environment. At the same time, this does not necessarily indicate a reversal in long-term adoption. Instead, it suggests that retail activity is becoming more sensitive to market cycles, aligning more closely with broader crypto conditions rather than growing independently of them.
Conclusion
Q1 2026 made the 2022 comparison hard to ignore. Stablecoin dominance rising sharply, capital rotating defensively, USDT and USDC diverging, automation surging, and retail pulling back — these patterns appeared together in mid-2022, and they are reappearing now. If broader bearish conditions persist through the year, stablecoins could see further demand and dominance gains in the coming quarters. The difference is that the asset class is entering this period from a much stronger structural position, with deeper institutional integration, various regulatory frameworks in place, and yield-bearing products that didn’t exist in the previous cycle.
However, supply growth could face real headwinds. USDT remains under pressure, and the regulatory fight over yield could make certain stablecoin practices less appealing. On the trading side, if current trends hold, 2026 is tracking below 2025 in total volume terms, which is consistent with a bear market environment.
The more important question heading into Q2 is whether the 2022 parallel plays out in full, meaning roughly a year of slow recovery before momentum returns, or whether the signs already emerging from on-chain accumulation signal a shorter cycle this time.
Sources
The data used for this research consists of publicly available information from DeFiLlama, Visa/Allium, Artemis, CoinGecko, StableWatch, Blockworks Research, CryptoQuant, and GrowThePie. Organic activity is measured as adjusted volume using Adjusted Transaction Methodology. Bot activity combines Bot and Other (Unadjusted) transactions, while internal transfers include internal smart contract transactions and intra-exchange transfers. Retail-sized transactions are defined as adjusted (non-bot) transactions that are less than $250, according to the same Adjusted Transaction Methodology. The observation period for this study was focused on Q1 2026, with data points ending March 31, 2026.
The web content provided by CEX.IO is for educational purposes only. The information and tools provided neither are, nor should be construed as, an offer, or a solicitation of an offer, or a recommendation, to buy, sell or hold any digital asset or to open a particular account or engage in any specific investment strategy. Digital asset markets are highly volatile and can lead to loss of funds.
The availability of the products, features, and services on the CEX.IO platform is subject to jurisdictional limitations. To understand what products and services are available in your region, please see our list of supported countries and territories. This page includes additional links to information about individual products, and their accessibility.


 English (US) ·