Bitcoin has experienced a modest recovery after several weeks of persistent selling pressure, allowing the asset to stabilize as broader market sentiment begins to improve. While volatility remains elevated across the crypto market, XRP has recently shown signs of short-term relief, with price action attempting to consolidate after an extended period of downside movement. The shift comes as analysts begin to examine on-chain data for clues about how supply dynamics within exchanges may be evolving.
According to CryptoQuant data, exchange reserve metrics can provide valuable insight into market behavior by tracking how assets move between private wallets and trading platforms. These flows often reveal subtle changes in investor positioning, liquidity conditions, and potential shifts in supply available for trading.
The report highlights the XRP Binance Exchange Daily Flow as a critical indicator. This metric tracks billions of dollars in XRP reserves to reveal how the asset moves across the exchange.
Unlike simple token balance metrics that only count the number of coins stored on the platform, this indicator also incorporates the market price of XRP. As a result, the reserve value reflects two interacting components: the number of XRP tokens held on Binance and the prevailing market price of the asset, providing a more complete view of liquidity dynamics.
Binance Reserve Decline Points To Changing Supply Dynamics
The report further explains that exchange reserve data can act as a proxy for available market liquidity. When large amounts of a cryptocurrency remain on trading platforms, those balances represent potential sell-side supply. Conversely, declining reserves often suggest that investors are withdrawing assets from exchanges, reducing the amount immediately available for sale.

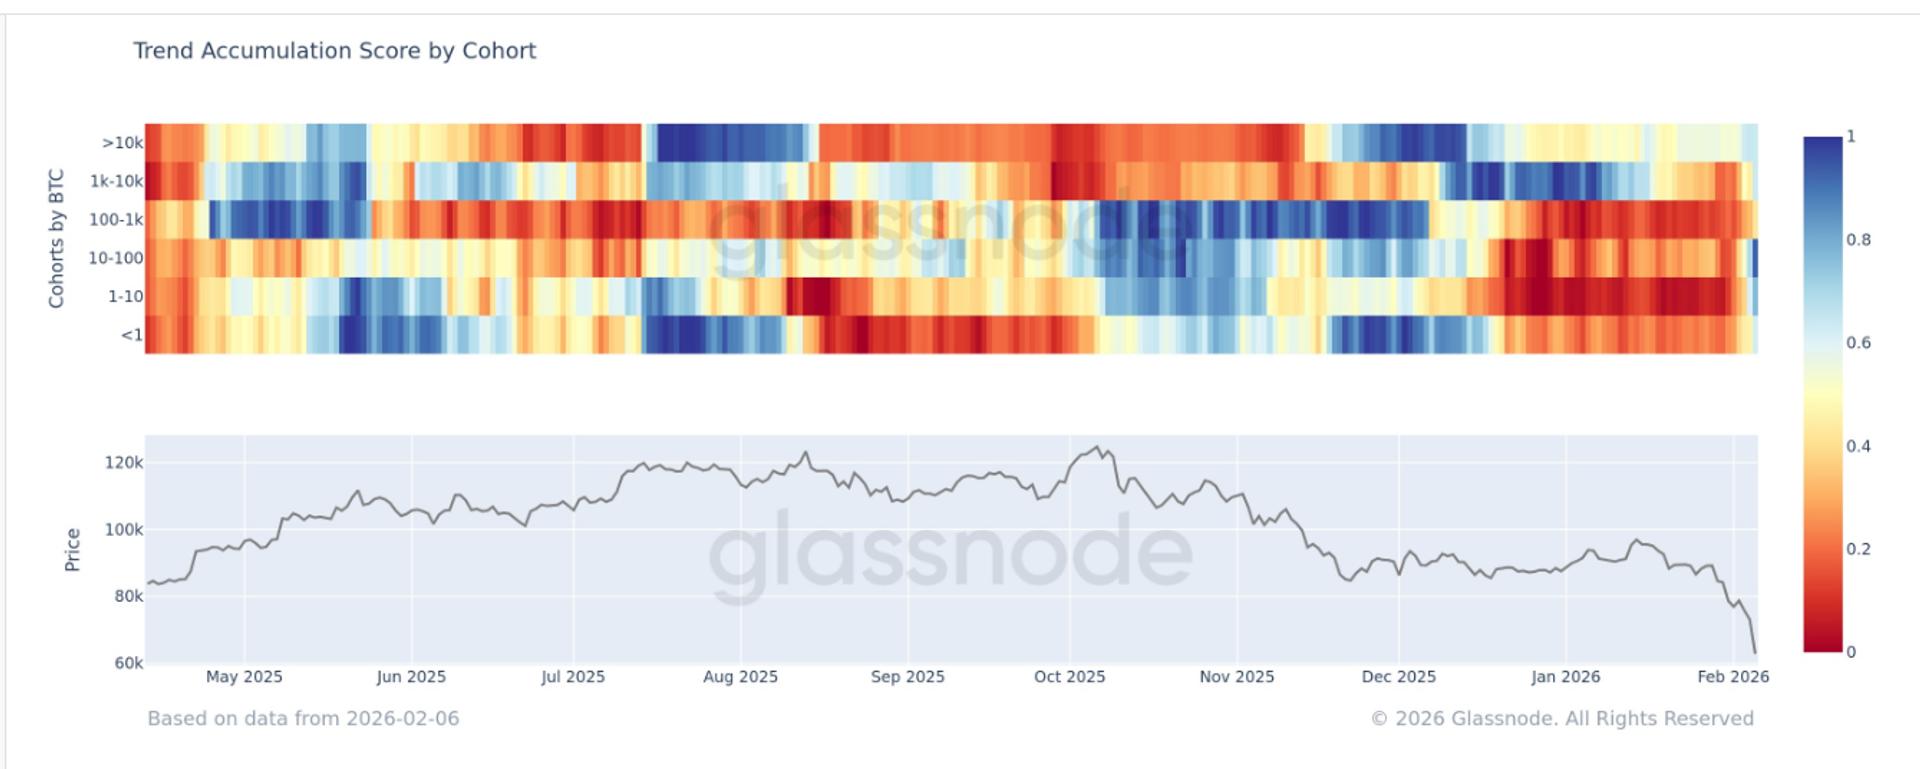
CryptoQuant’s analysis highlights a notable shift in Binance’s XRP reserves. The total dollar value of XRP held on the exchange has fallen sharply, reaching approximately $3.9 billion by March 6. This represents a significant contraction compared with previous peaks observed during the cycle.
Looking back at historical periods provides useful context. The highest levels of XRP reserves on Binance occurred in January and July 2025, when the total value of reserves exceeded $10 billion. During that period, a large quantity of XRP remained on the exchange, indicating abundant liquidity and significant potential selling pressure.
Following those peaks, the market entered a prolonged decline, with XRP eventually dropping more than 60% and trading below $1.35.
From a structural perspective, the current reduction in reserves may alter supply dynamics. When XRP leaves exchanges, the immediately tradable supply decreases. If market demand remains stable while exchange balances shrink, the reduced availability of tokens can gradually ease selling pressure and create conditions that support price stabilization or recovery.
XRP Consolidates After Sharp Correction
The chart shows XRP trading near $1.40 following a steep correction that pushed the asset significantly below its previous cycle highs. After peaking above $3.40 during the mid-2025 rally, XRP entered a prolonged downtrend characterized by a sequence of lower highs and sustained selling pressure.

Technically, the asset recently broke below its 100-day moving average and remains well under the 50-day and 200-day moving averages, indicating that the broader trend is still tilted to the downside. The sharp drop in early 2026 forced XRP briefly below the $1.20 region before buyers stepped in, triggering a short-term rebound and allowing the price to stabilize in the $1.30–$1.45 range.
This zone is now acting as a temporary consolidation area as the market attempts to absorb the heavy selling pressure that defined the previous weeks. However, the inability to reclaim the $1.50 level highlights that bullish momentum remains limited in the short term.
From a structural perspective, XRP must reclaim the descending moving averages to signal a stronger recovery. The first major resistance sits near the $1.90–$2.00 region, where the 200-day moving average is currently trending.
On the downside, the $1.25–$1.30 zone remains the closest support. Losing that level could reopen the path toward the recent lows near $1.20 if selling pressure intensifies again.
Featured image from ChatGPT, chart from TradingView.com


 English (US) ·