Ethereum price started a recovery wave above the $2,050 zone. ETH is now showing positive signs and might aim for more gains above $2,150.
- Ethereum started a recovery wave above the $2,050 zone.
- The price is trading above $2,050 and the 100-hourly Simple Moving Average.
- There was a break above a declining channel with resistance at $2,080 on the hourly chart of ETH/USD (data feed via Kraken).
- The pair could start a fresh decline if it stays below the $2,150 zone.
Ethereum Price Clears Resistance
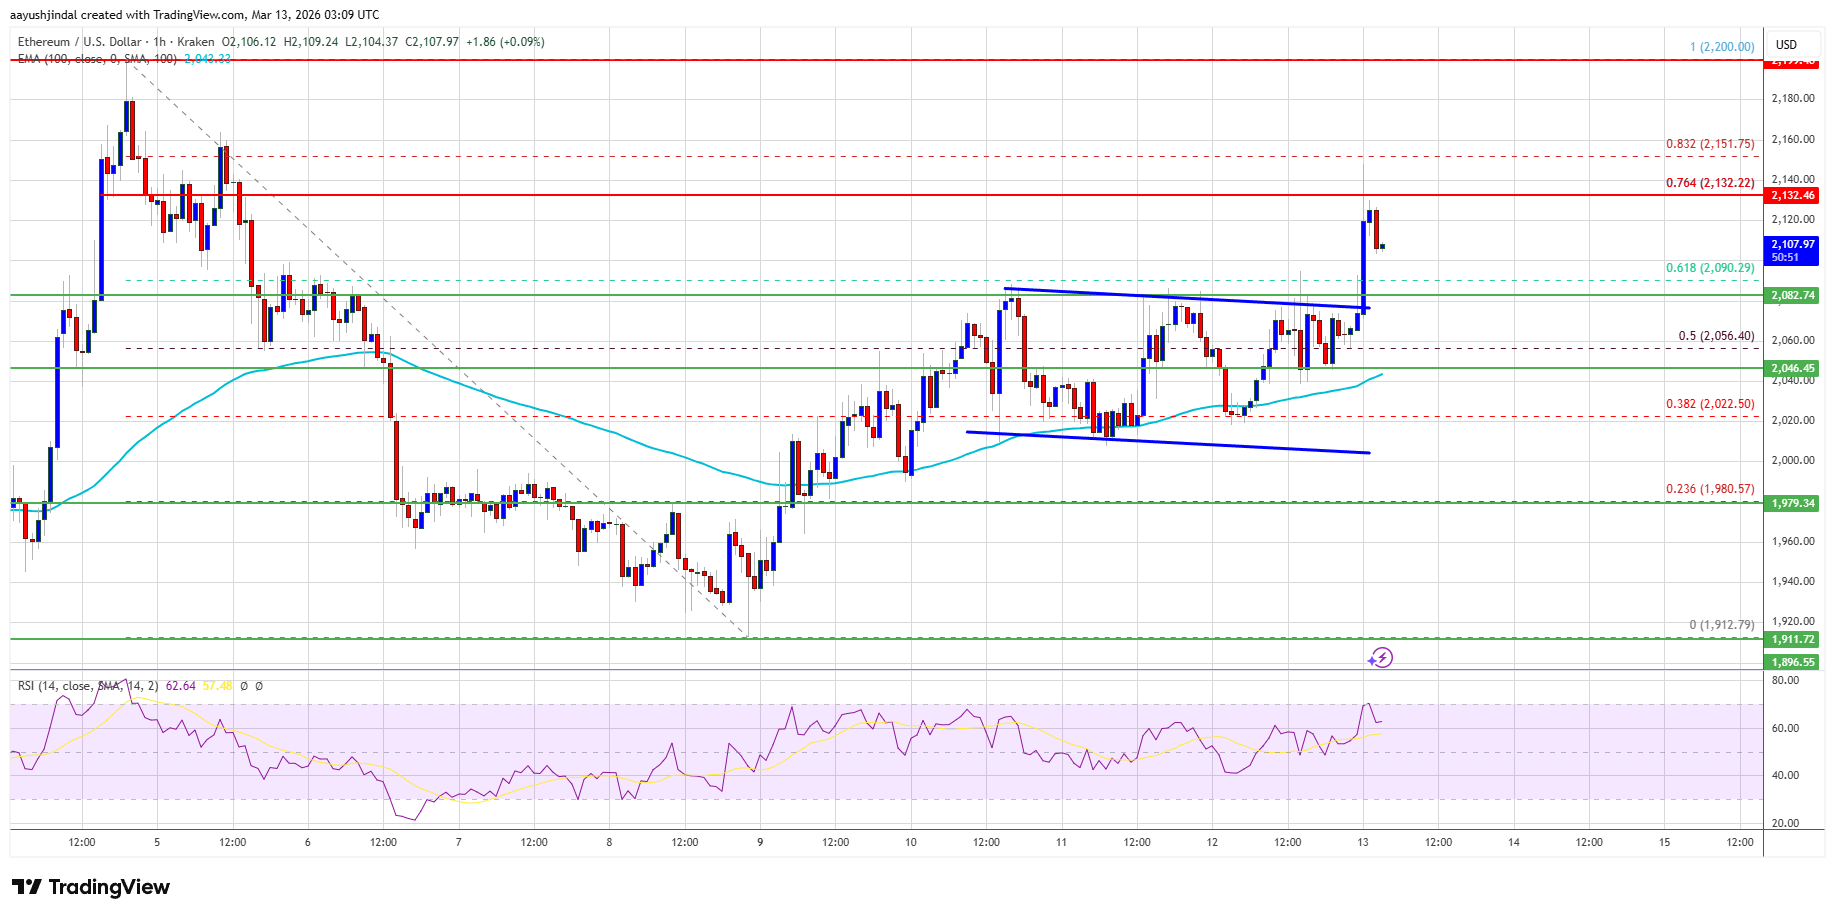
Ethereum price extended its recovery wave after it cleared the $1,980 zone, like Bitcoin. ETH price was able to clear the $2,020 resistance zone.
The bulls pushed the price above the 61.8% Fib retracement level of the downward move from the $2,200 swing high to the $1,912 low. Besides, there was a break above a declining channel with resistance at $2,080 on the hourly chart of ETH/USD.
Finally, the price tested the 76.4% Fib retracement level of the downward move from the $2,200 swing high to the $1,912 low. Ethereum price is now trading above $2,080 and the 100-hourly Simple Moving Average.
If the bulls remain in action above $2,050, the price could attempt another increase. Immediate resistance is seen near the $2,135 level. The first key resistance is near the $2,150 level. The next major resistance is near the $2,220 level. A clear move above the $2,220 resistance might send the price toward the $2,250 resistance. An upside break above the $2,250 region might call for more gains in the coming days. In the stated case, Ether could rise toward the $2,320 resistance zone or even $2,340 in the near term.
Another Decline In ETH?
If Ethereum fails to clear the $2,135 resistance, it could start a fresh decline. Initial support on the downside is near the $2,080 level. The first major support sits near the $2,050 zone.
A clear move below the $2,050 support might push the price toward the $2,000 support. Any more losses might send the price toward the $1,950 region. The main support could be $1,920.
Technical Indicators
Hourly MACD – The MACD for ETH/USD is gaining momentum in the bullish zone.
Hourly RSI – The RSI for ETH/USD is now above the 50 zone.
Major Support Level – $2,050
Major Resistance Level – $2,150


 English (US) ·