Dogecoin started a fresh decline below the $0.0950 zone against the US Dollar. DOGE is now consolidating losses and might face hurdles near $0.0920 and $0.0932.
- DOGE price started a fresh decline below the $0.0950 level.
- The price is trading below the $0.0935 level and the 100-hourly simple moving average.
- There was a break below a bullish trend line with support at $0.0920 on the hourly chart of the DOGE/USD pair (data source from Kraken).
- The price could extend losses if it stays below $0.0920 and $0.0932.
Dogecoin Price At Risk of More Downside
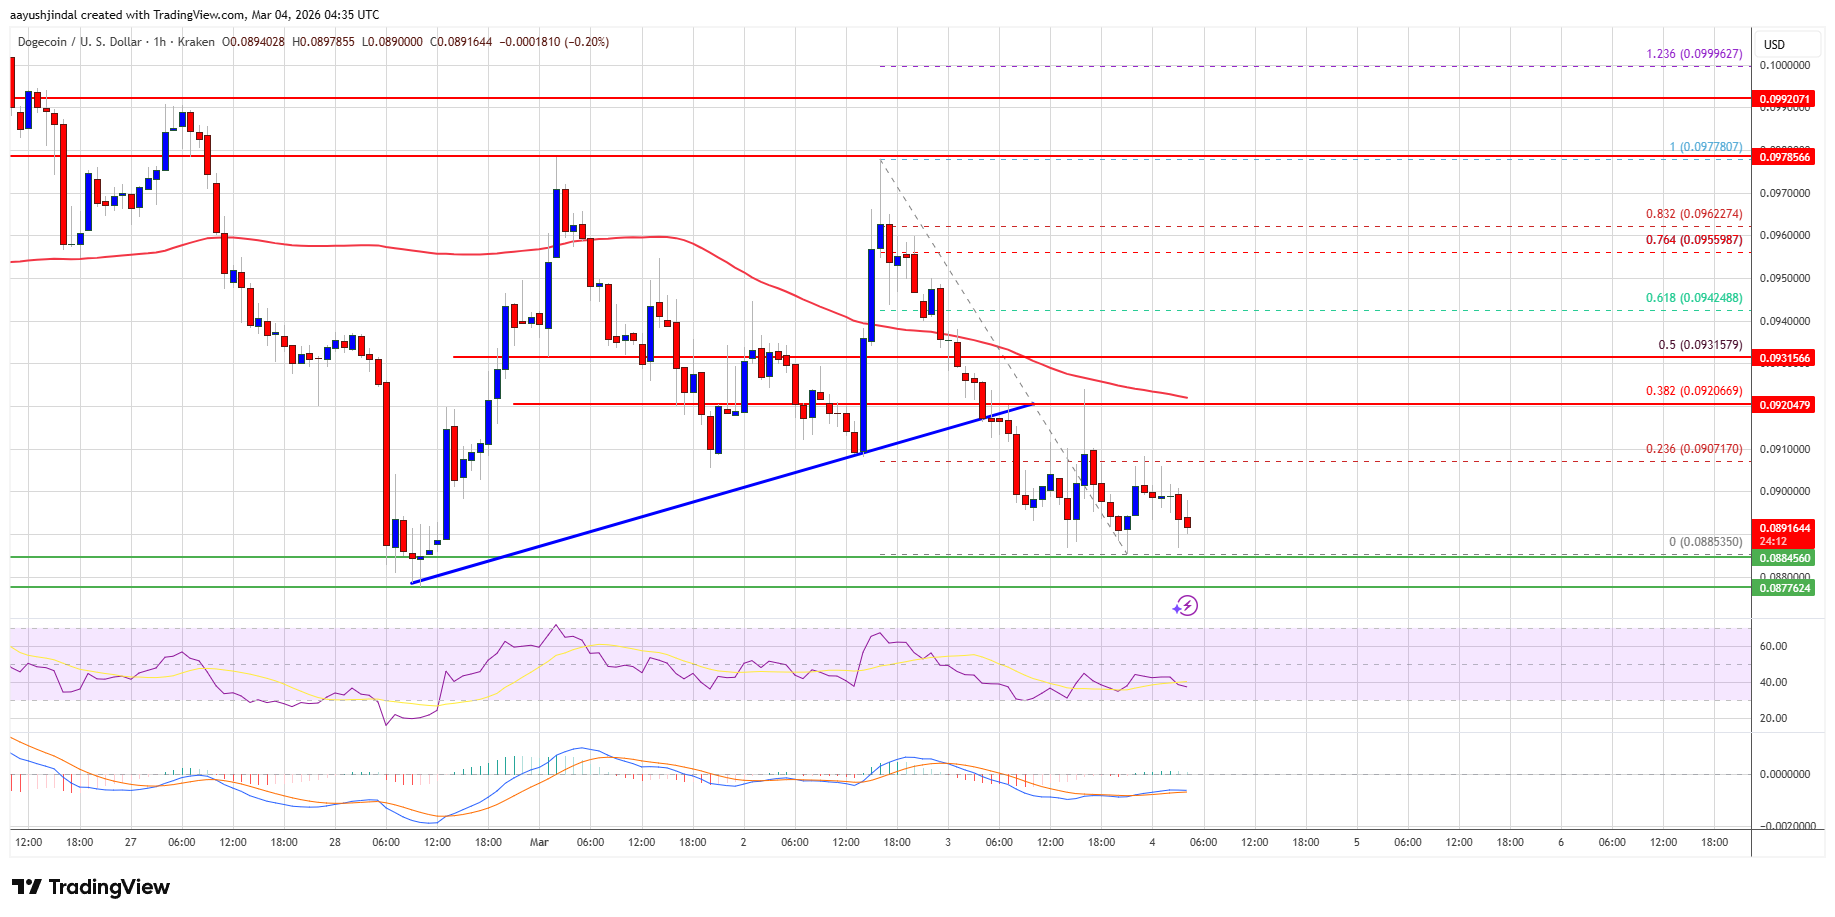
Dogecoin price started a fresh decline after it closed below $0.10, like Bitcoin and Ethereum. DOGE declined below the $0.0950 and $0.0932 support levels.
The price even traded below $0.0920. Besides, there was a break below a bullish trend line with support at $0.0920 on the hourly chart of the DOGE/USD pair. A low was formed near $0.0885, and the price is now showing bearish signs. There was a recovery wave above $0.0900, but the price stayed below the 38.2% Fib retracement level of the downward move from the $0.0977 swing high to the $0.0885 low.
Dogecoin price is now trading below the $0.0932 level and the 100-hourly simple moving average. If there is a recovery wave, immediate resistance on the upside is near the $0.0920 level.
The first major resistance for the bulls could be near the $0.0932 level and the 50% Fib retracement level of the downward move from the $0.0977 swing high to the $0.0885 low. The next major resistance is near the $0.0950 level.
A close above the $0.0950 resistance might send the price toward the $0.0975 resistance. Any more gains might send the price toward the $0.10 level. The next major stop for the bulls might be $0.1020.
Downside Break In DOGE?
If DOGE’s price fails to climb above the $0.0932 level, it could continue to move down. Initial support on the downside is near the $0.0885 level. The next major support is near the $0.0850 level.
The main support sits at $0.0820. If there is a downside break below the $0.0820 support, the price could decline further. In the stated case, the price might slide toward the $0.0800 level or even $0.0750 in the near term.
Technical Indicators
Hourly MACD – The MACD for DOGE/USD is now gaining momentum in the bearish zone.
Hourly RSI (Relative Strength Index) – The RSI for DOGE/USD is now below the 50 level.
Major Support Levels – $0.0885 and $0.0850.
Major Resistance Levels – $0.0920 and $0.0932.


 English (US) ·